 Document
1. Introduction
POTSON is an acronyms that stands for Portal Of Tumor Suppressors and ONcogenes. It can aid in the rapid and efficient discovery of tumour suppressive, oncogenic, and dual role effects at the gene level.
1.1 A typical POTSON analysis pipeline
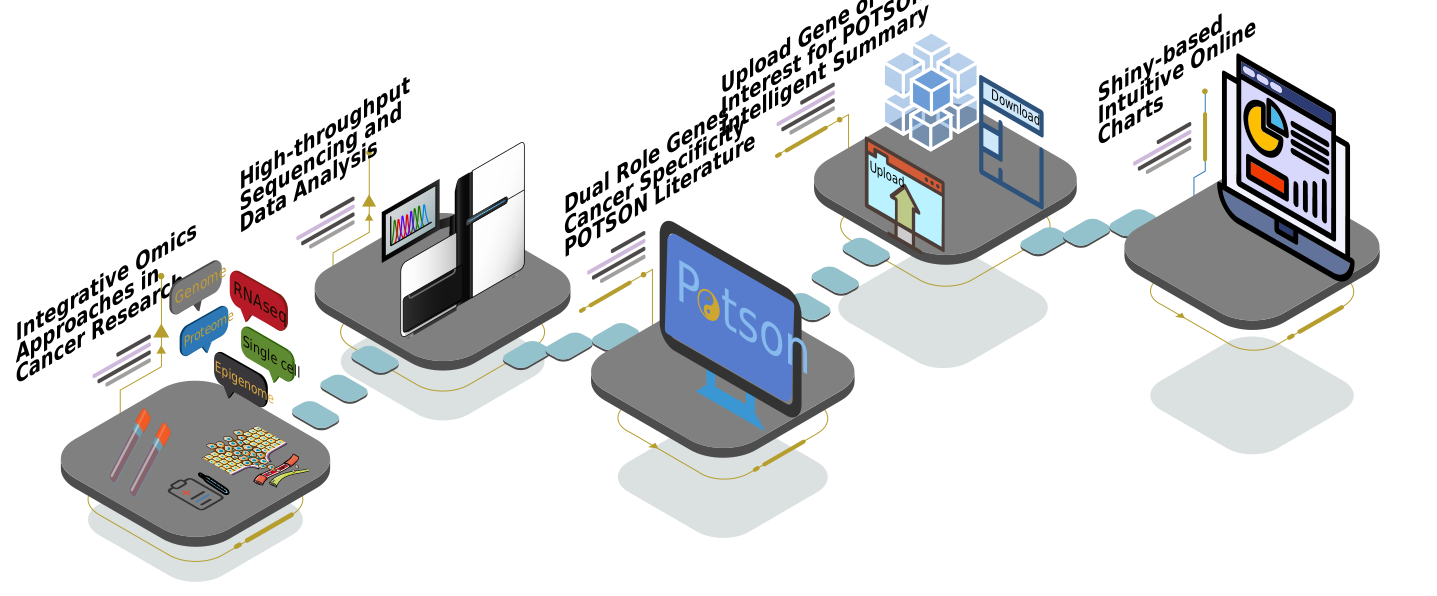
The most important question in cancer genomics research is a biological understanding of large data sets generated by high-throughput technologies such as whole genome sequencing and RNA-Seq. As a result, a typical omics-based cancer discovery begins with methylation analysis (epigenetic level), followed by differential gene expression (mRNA level), miRNA/ncRNA expression profiling (non-coding transcript level), differential protein expression and phosphorylation analysis (proteomics level), and finally metabolomics analysis (metabolite level). These analyses typically yield a list of genes that are differentially expressed/methylated in multiple groups. Furthermore, genome-wide association studies, genome/exome sequencing, and genes with loss/gain-of-function variants are widely used to track the activity of thousands of genes, generating gene lists for further analysis. Therefore, gaining biological insight from the generated gene list is the primary challenge to realising the potential of these technologies.
Tumor suppressor genes (TSGs) and oncogenes are two types of genes that play opposing roles in cancer development. In brief, oncogenes are specific genes that can transform cancer cells, stimulate cell proliferation, and promote cell survival by interfering with apoptosis. TSGs inhibit cell proliferation and tumor development by acting on the inverse side of cell growth control. In many tumors, these genes are lost or inactivated, removing negative regulators of cell proliferation and contributing to tumour cell abnormal proliferation. In addition to TSGs and oncogenes, an increasing number of driver genes have been discovered to play both tumor suppressor and oncogene roles depending on the biological context, such as epigenetic regulation, interacting partners, cancer type, and tissue specificity. A comprehensive investigation of TSGs and oncogenes may expand our understanding of the relationship between TSGs and OCGs in cancer development. Our TSGene 2.0 database firstly complied a list of 73 TSGs that also play oncogenic roles in various cancers. As the integrative resource for tumor suppressors and oncogenes, POTSON offers the most comprehensive gene list (251 known genes) with dual role based on literature information. As a result, a typical POTSON analysis began with the generation and integration of omics data. After generating the gene list outside of POTSON, the user could use our POTSON to map the gene and generate an intelligent summary. The following are the key features.
Please check the Data menu.
Please check the Intelligent summary menu.
Please check the Dashboard menu.
1.2 Integration of tumor suppressors and oncogenes from five databases
The human TSGs and oncogenes were retrieved from five different databases, including: TSGene, ONGene, OncoKB, Cancer Gene Census, and Network of Cancer Genes. TSGene and ONGene, in general, are specific for TSGs and oncogenes with literature information. TSGs and oncogenes have also been collected from the OncoKB, Cancer Gene Census, and Network of Cancer Genes databases. However, some OncoKB genes are missing literature information. We made every effort to connect the relevant literature to the genes. Based on 18,295 PubMed abstracts, a total of 2285 genes in POTSON were identified and mapped to the most recent records in the NCBI Gene database. The basic gene information, including the official gene symbol, gene type, alias, chromosome and map locations, was obtained from the NCBI Gene database.
1.3 Driver genes with dual roles in cancer development
The 251 dual role genes were defined based on the known TSGs and oncogenes from the five databases. The associated literature and cancer-type information were assigned automatically as well. It should be noted that:
2. If it is not necessary to distinguish between dual role genes, the total number of oncogenes should be 1045 (794 oncogenes + 251 dual role genes).
1.4 Computational prediction of driver genes with tumor suppressive and oncogenic roles
To date, three tools have been developed to predict tumour suppressive and oncogenic roles: TUSON (Tumor Suppressor and OG Explorer), DORGE (Discovery of Oncogenes and tumor suppressoR genes using Genetic and Epigenetic features), and 20/20+ machine-learning method. Specifically, TUSON and 20/20+ can predict protein-coding TSGs and ONGs using mutational signatures from large-scale cancer genomics datasets. The DORGE employed both genetic and epigenetic characteristics. In addition to these three tools, we integrated the following six tools for cancer driver gene prediction as well.
- MutsigCV is a model that use mutational covariates to identify genes that have been significantly mutated in cancer genomes.
- MuSiC stands for Mutational Significance in Cancer.
- OncodriveCLUST is designed to identify genes whose mutations favour large spatial clustering.
- OncodriveFML is a general framwork for identifying cancer driver mutations in coding and non-coding regions.
- OncodriveFM is the predecessor to OncodriveFML.
- ActiveDriver is a novel method for identifying genes that have significant phosphorylation-related mutations.
2. Gene pages and data browsing
To facility the data access, POTSON was developed in a user-friendly manner, which means all pages are responsive in common web browsers and mobile devices. In addtion, we included the data summary charts in each page. In general, the literature and functional information for all 2285 genes were saved in POTSON for user browsing. For each gene, we built a tabbed responsive interface with nine categories of information including: Basic information, Literature, Driver prediction, Epigenetic feature, Gene ontology, Pathway, Expression, Survival, and Interaction.
2.1 Cancer type and literatures
A word cloud summary was presented in the Literature view to highlight and cluster the key topic in various sizes. If the is mouse over the keywords, the details will be revealed. Furthermore, all relevant literature was listed in the table below the word cloud. The curated cancer type information was presented in the table for further exploration. The records will be sorted based on the cancer type information if you click the "Cancertype" header.
2.2 Functional and clinical features
The 14 driver prediction results are organised as on the above "Driver prediction" page. The adjusted Q-values for each predictive model are displayed using a bar chart (the less, the better). Under the bar chart, the tabular results were listed. We separate the tumour suppressor and oncogene prediction models for TUSON, DORGE, and 20/20+.
In the "Epigenetic" page, a total of 11 histone modification features were compiled from the Human Encyclopedia of DNA elements (ENCODE) project. In POTSON, the peak heights and lengths of these 11 histone modifications were piped up for review.
Bar charts dynamically visualise functional features such as gene ontology and pathway in the "Gene ontology" and "Pathway" pages.
The overall expression statistics for all genes in the TCGA pan-cancer cohorts were compiled using the BioXpress database, which recorded mRNA/miRNA expression levels.
The prognostic features of each gene in 23 TCGA cancers were compiled in the "Survival" page using the PRECOG - PREdiction of Clinical Outcomes from Genomic Profiles database.
The gene-gene interaction information was compiled from the PathwayCommons, a collection of gene interaction data from 22 databases.
2.3 Data browsing and search
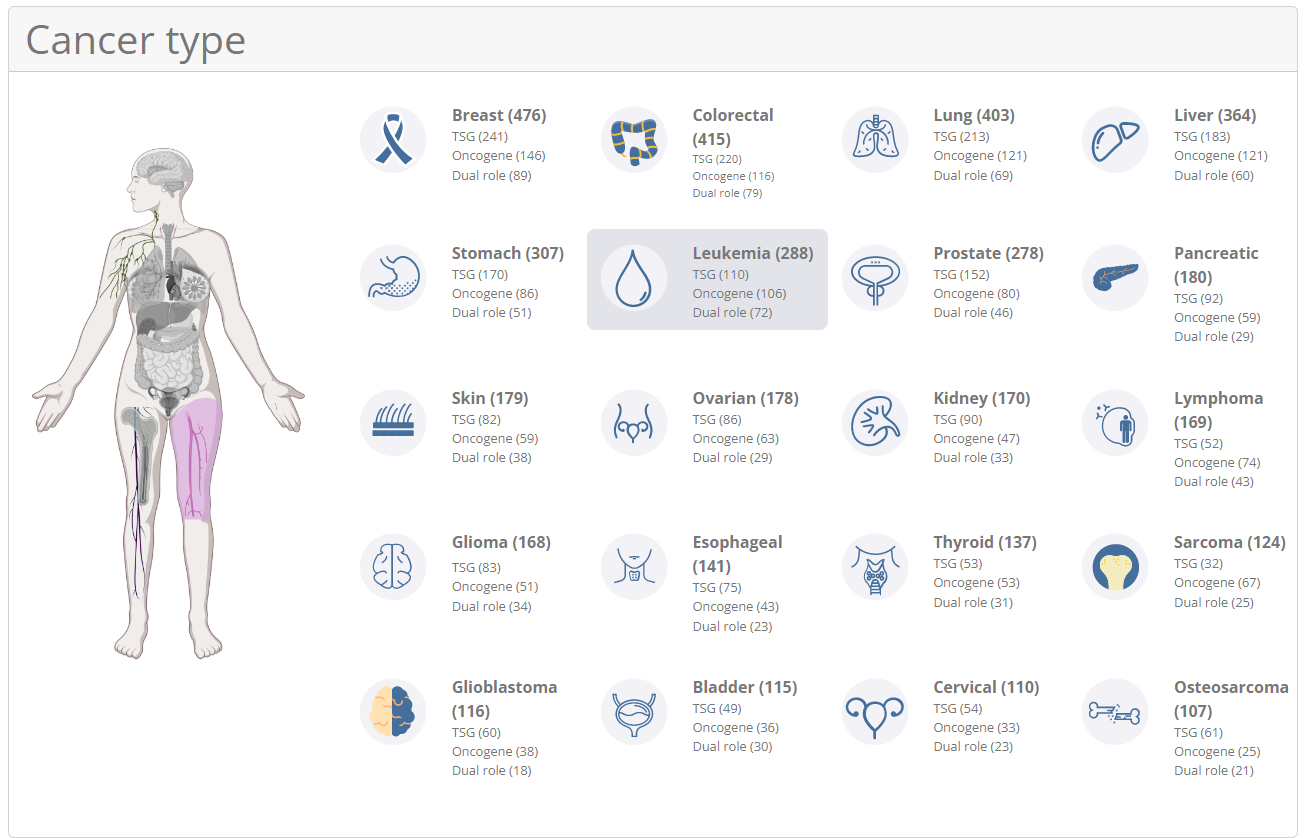
POTSON provided four implemented options under the "Data" menu to facilitate data reuse: browse, search, data table, and bulk download. Users can easily filter the gene list using one or more criteria. The "Cancer type" section of the browsing page, for example, contains the most comprehensive summary of cancer type specific tumour suppressors, oncogenes, and dual-role genes. To obtain all of the tissue-specific cancer driver genes, users could use the bodymap on the left or directly click on the tissue name.
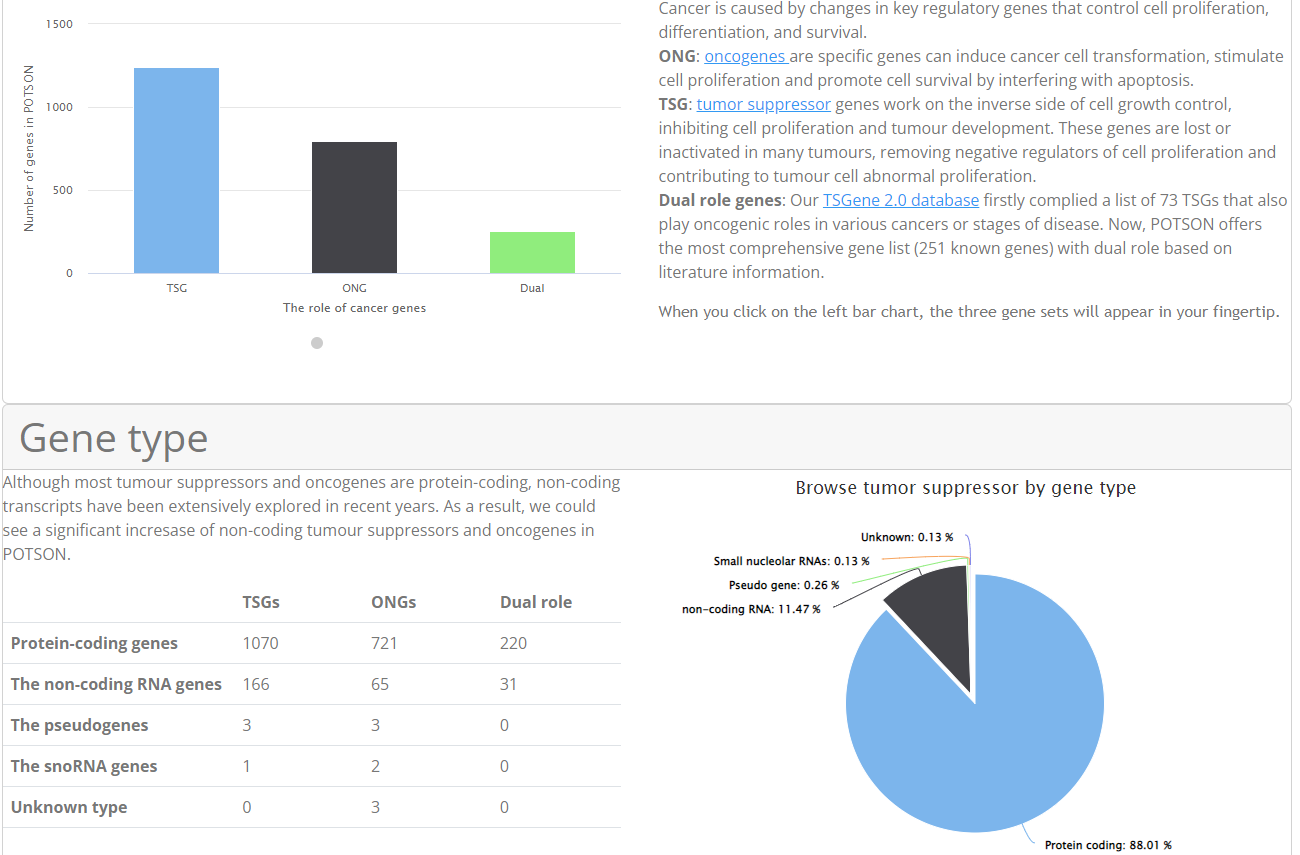
Furthermore, users could access the gene list with different roles and gene types by clicking the bar chart and the pie chart in the browse page.
Users can go directly to Search page for a general search. Users could easily find relevant genes and literatures in the POTSON by entering their genes or keywords of interest. By entering the symbol "WT1," for example, the corresponding results are displayed in a tabular format, including gene ID, gene symbols, gene type, and roles in cancers. Detailed annotations are accessible via the hyperlink on the gene ID.
The data table can be used to filter the gene list based on a combination of multiple fields, which is another convenient way to explore the gene list in POTSON. Users could easily find relevant genes by entering the genes or keywords of interest and focusing on the gene alias and description. The data table in tabular format will refresh quickly, including gene ID, gene symbols, synonyms, gene description, and roles in cancers. Detailed annotations are accessible via the hyperlink on the gene ID.
3. Intelligent data summary
We provided an intelligent data extraction module to maximise the POTSON interpretation of the gene, transcript, and protein list. The input are genes of interest that will be overlapped to the 2285 genes in POTSON. The system will then extract all annotation and genomics profiling data for the previously identified POTSON genes.
3.1 Uploading genes of interest
Instead of searching for a single gene, the user could upload a gene list on the Intelligent summary page. The POTSON will map the input to all 2285 genes automatically and extract annotation and genomics profiles. These downloadable files could be used for any integrative analysis or to feed into our online chart on the Dashboard page.
3.2 Task retrieve
The intelligent summary results are downloaded using the Task retrieve page. In general, a zip file will be downloaded for further visualisation and summarization.
Our Intelligent summary normally generates hundreds of files. In general, the first words of the filename indicates which tools are appropriate for the file. Users could also make changes to the example data using the Excel software. Despite the fact that our system accepts four formats (csv, txt, xls, xlsx), our Intelligent summary will only generate files in txt format as the default. Please feel free to change and convert as you see fit.
4. Dashboard for online chart
The POTSON dashboard is an intuitive visualisation portal for tumor suppressors and oncogenes generated by the POTSON intelligent summary. It includes 12 tools in four popular analysis modules, including venn diagrams, pie charts, circos plots, heatmaps, volcano plots, MA plots, network plots, four quadrant diagrams, principal component analysis (PCA), and pairwise correlation analysis. These tools are extremely useful and do not require any programming knowledge. Our POTSON dashboard generates charts at the publication level. In a nutshell, the combination of our POTSON intelligent summary and dashboard will allow the researcher to quickly investigate the tumour suppressor and oncogene.
POTSON dashboard accepts a variety of file formats, including csv, txt (tab-separated), xls, and xlsx. Furthermore, the dashboard can produce high-quality publication-ready figures in pdf, png, jpeg, and tiff formats. Let's use heatmap as an example to demonstrate POTSON dashboard's capabilities. First, on the POTSON dashboard's left panel, select [heatmap] from the driver summary and profile analysis modules. The system will direct the user to the heatmap page, where the user can configure how the plots in the middle are generated. The plot in the right panel will be automatically refreshed.
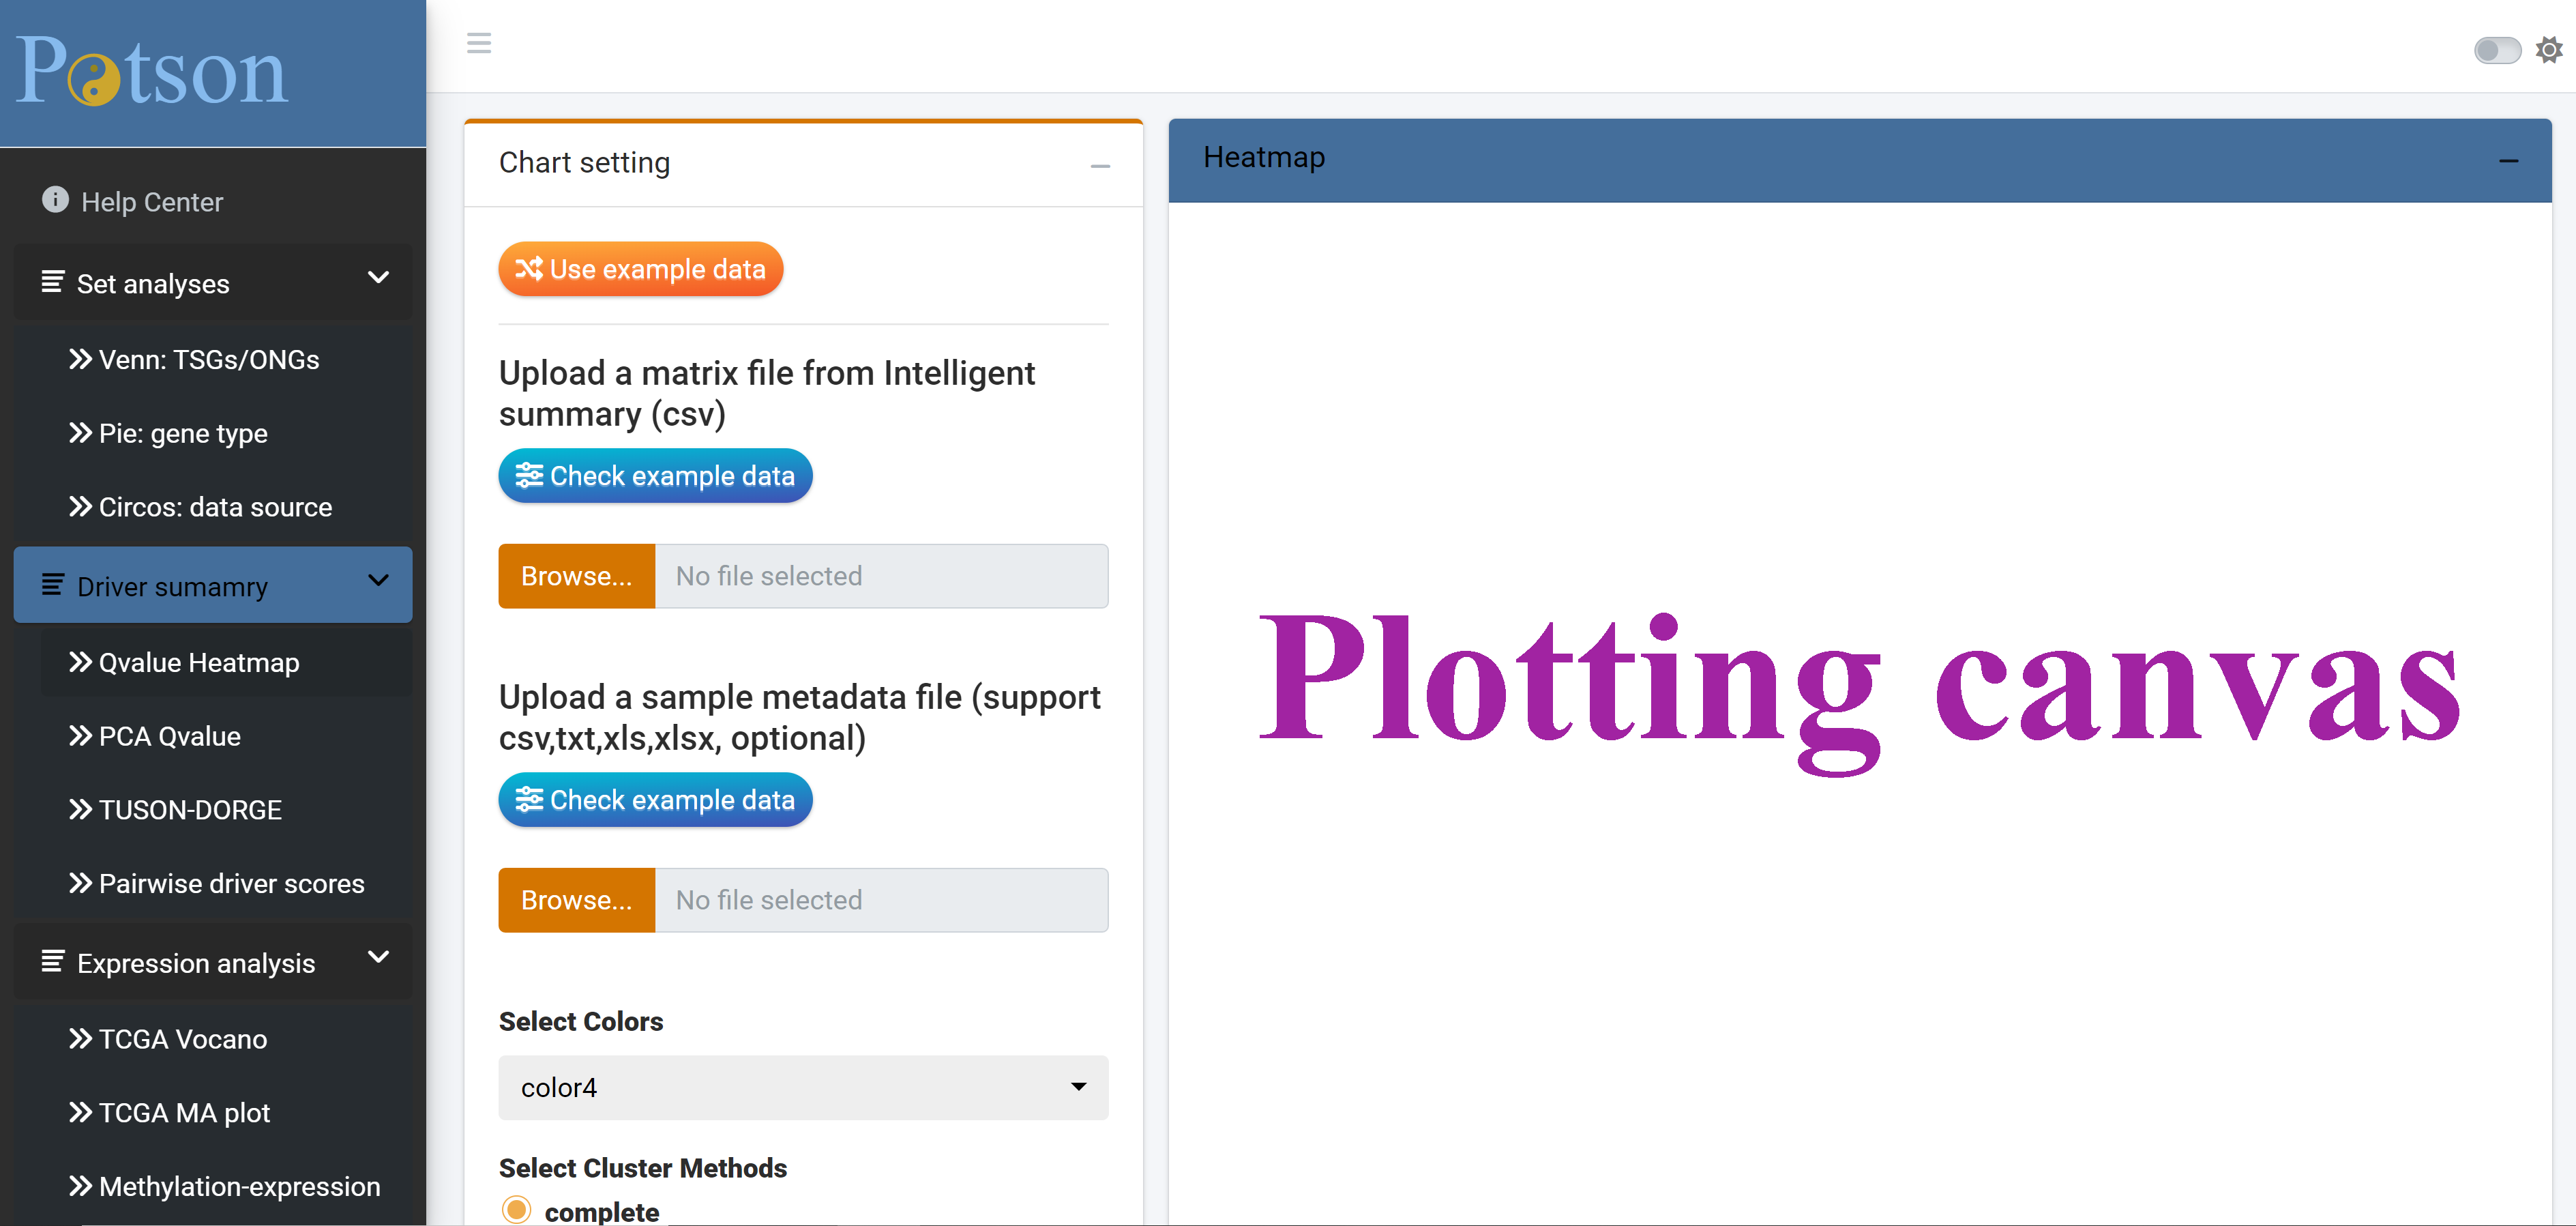 POTSON dashboard accepts a variety of file formats, including csv, txt (tab-separated), xls, and xlsx. Furthermore, the dashboard can produce high-quality publication-ready figures in pdf, png, jpeg, and tiff formats. Let's use heatmap as an example to demonstrate POTSON dashboard's capabilities. First, on the POTSON dashboard's left panel, select [heatmap] from the driver summary and profile analysis modules. The system will direct the user to the heatmap page, where the user can configure how the plots in the middle are generated. The plot in the right panel will be automatically refreshed.
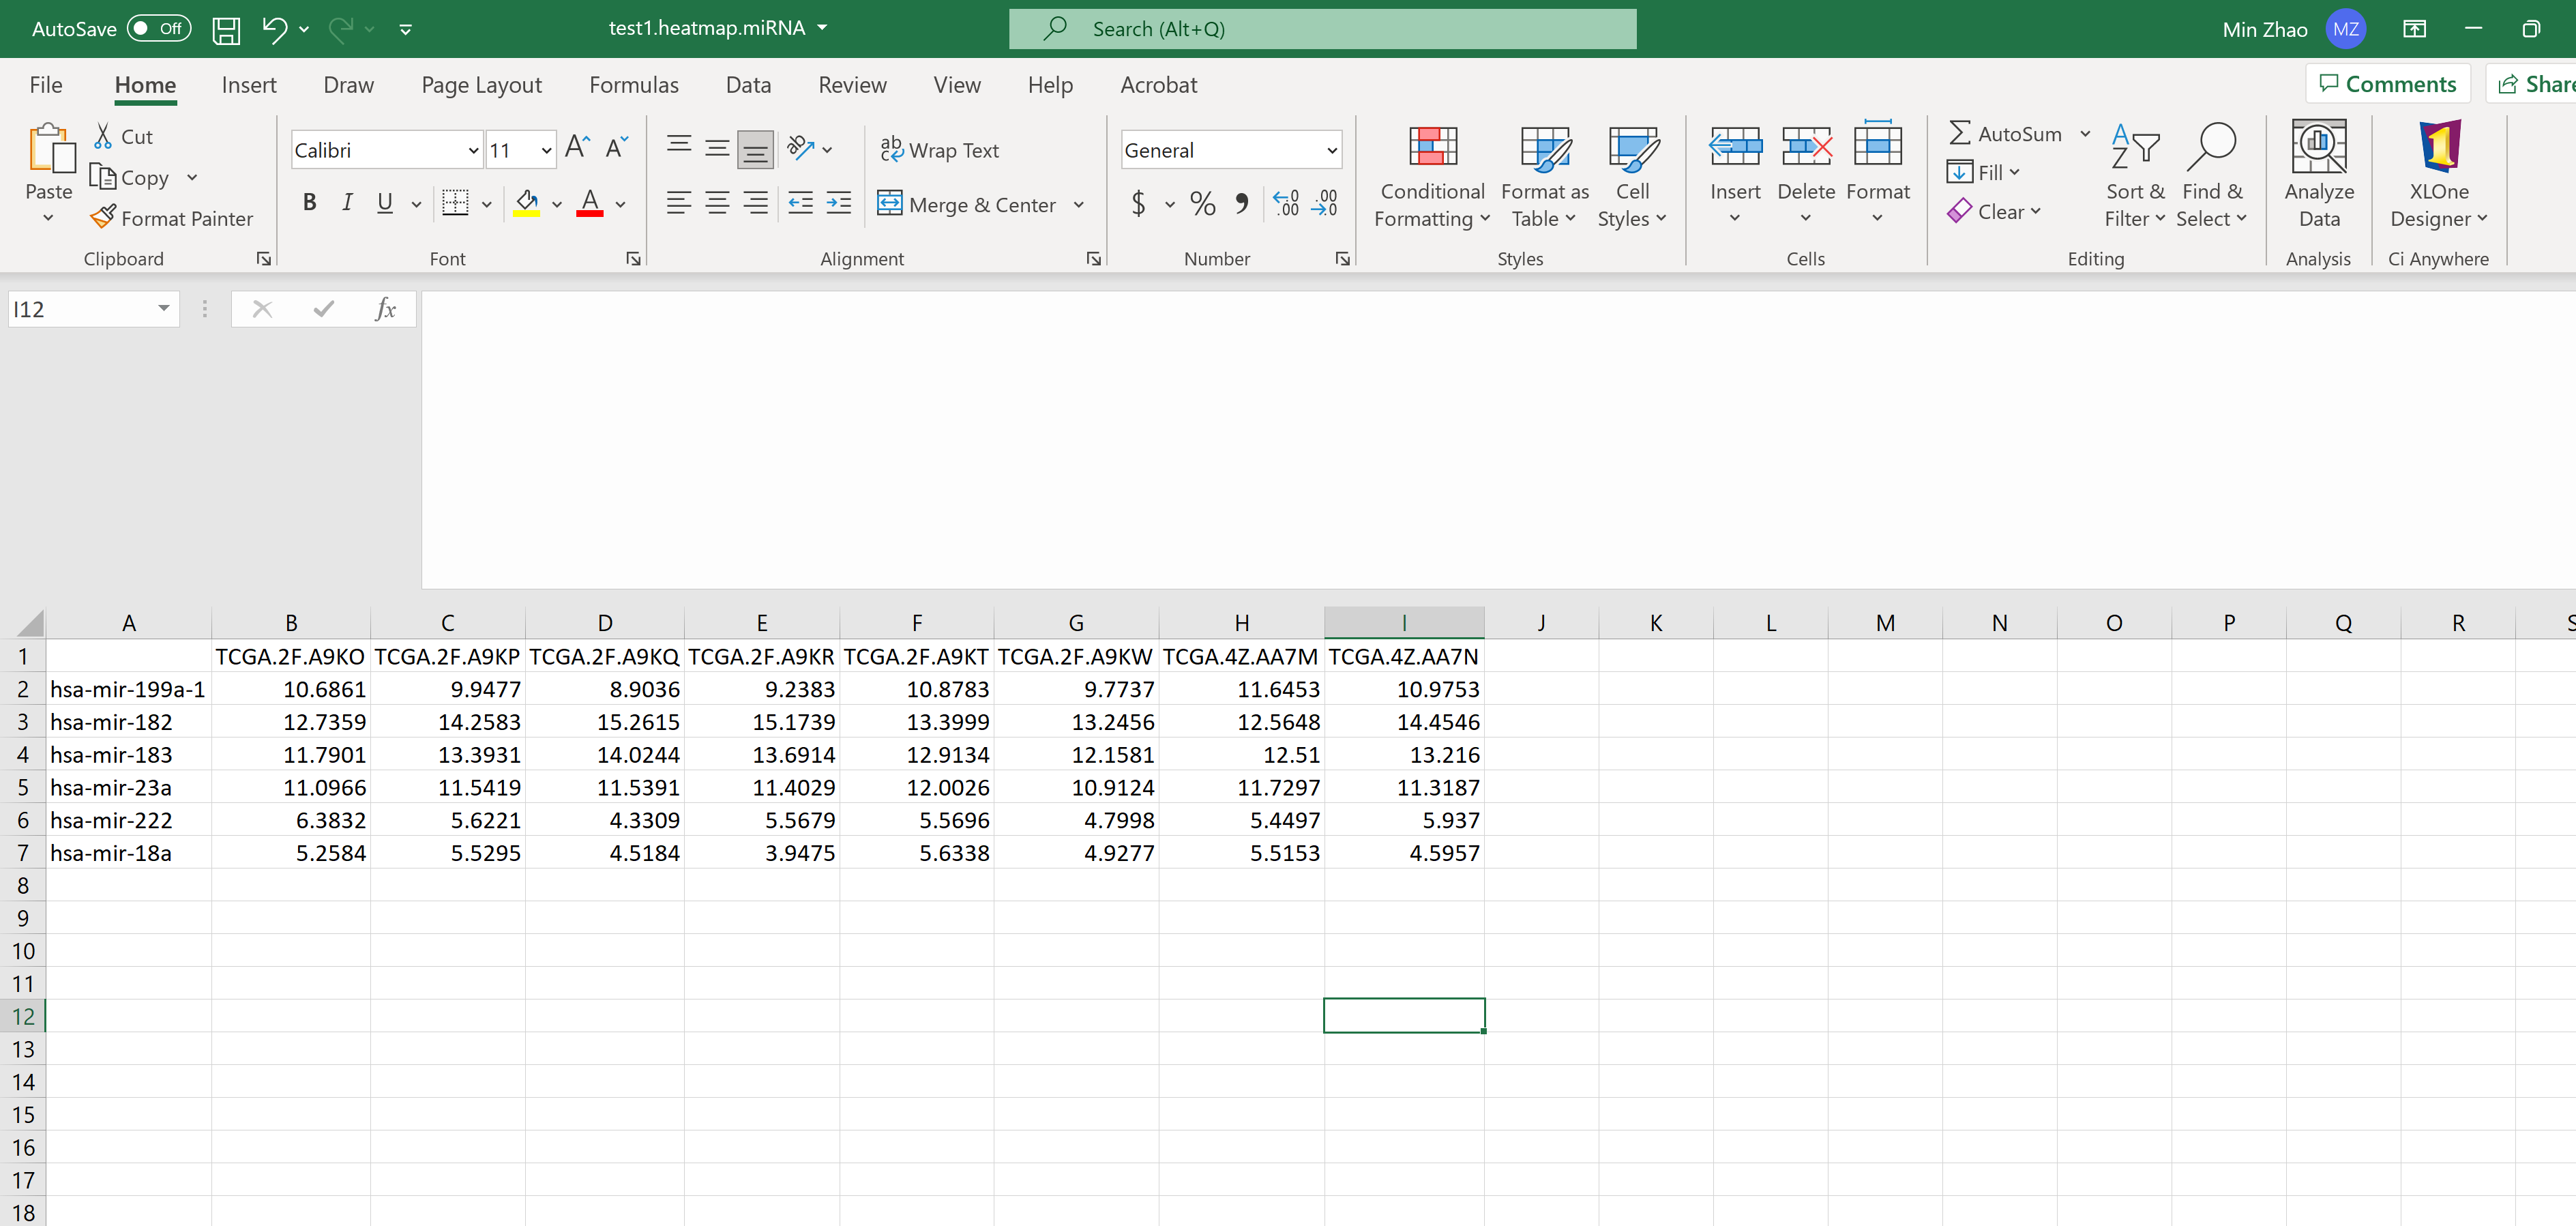
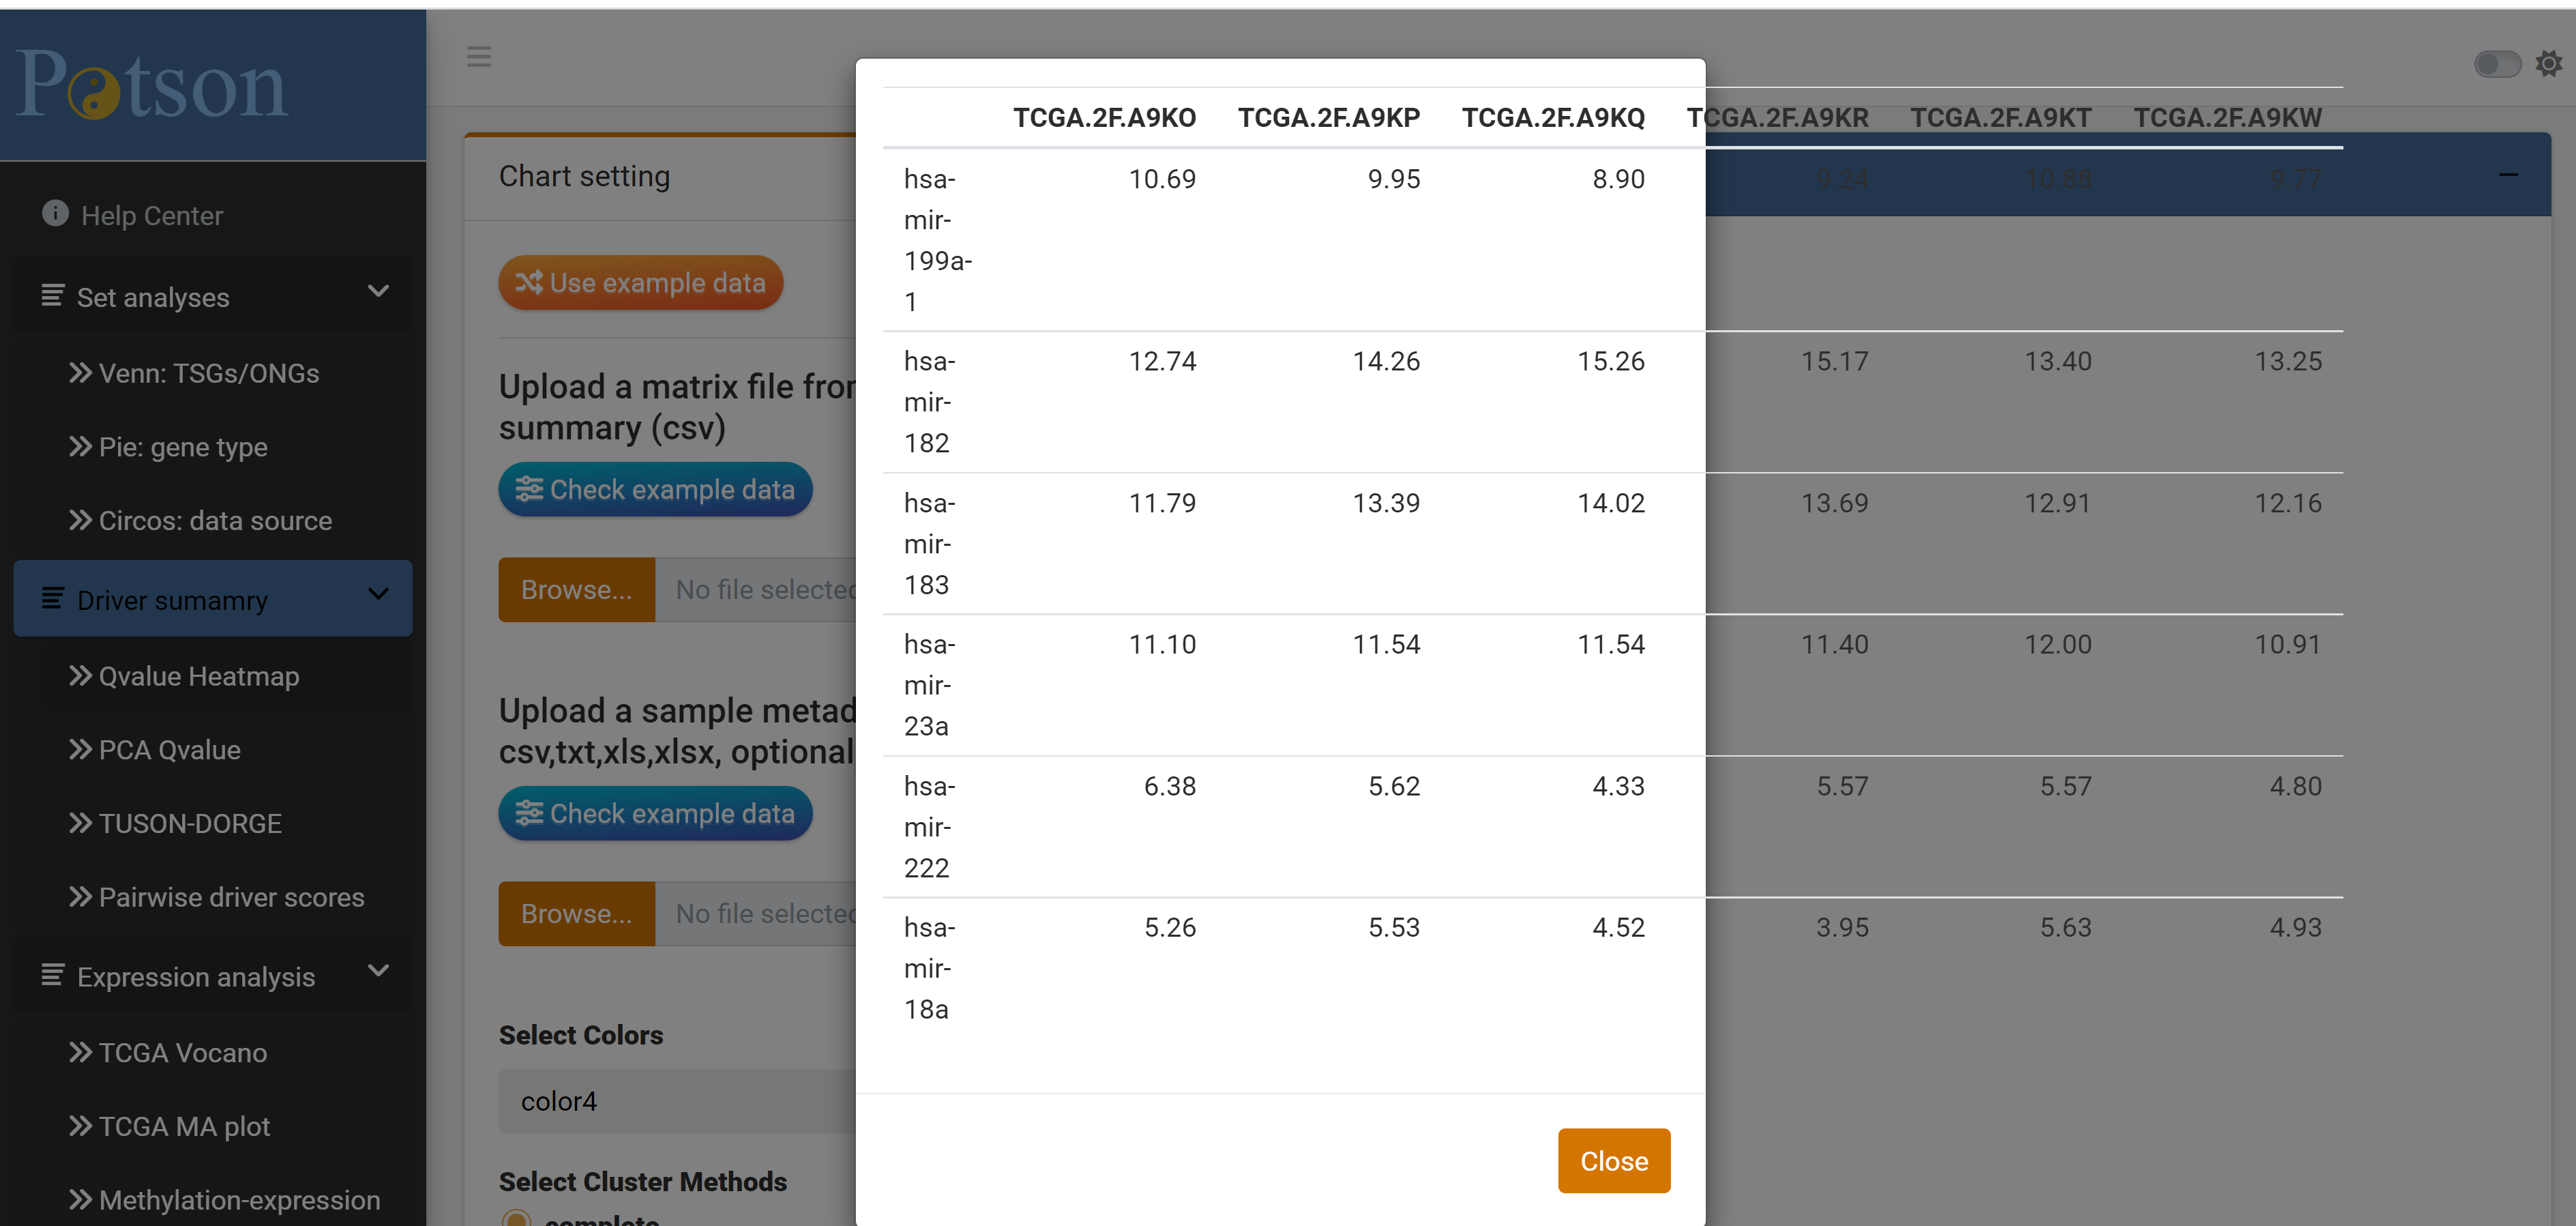 Before uploading a file, the user can check the information by clicking the [Check example data] button. The screenshot is shared as below. You could also compare the differences between the sample file and the outputs from our Intelligent summary. Please keep in mind that the heatmap will not work if the output file from Intelligent summary is empty. This could be because the gene list uploaded to the Intelligent summary contains no mapping to the POTSON 2285 genes.
4.1 The overall set analysis
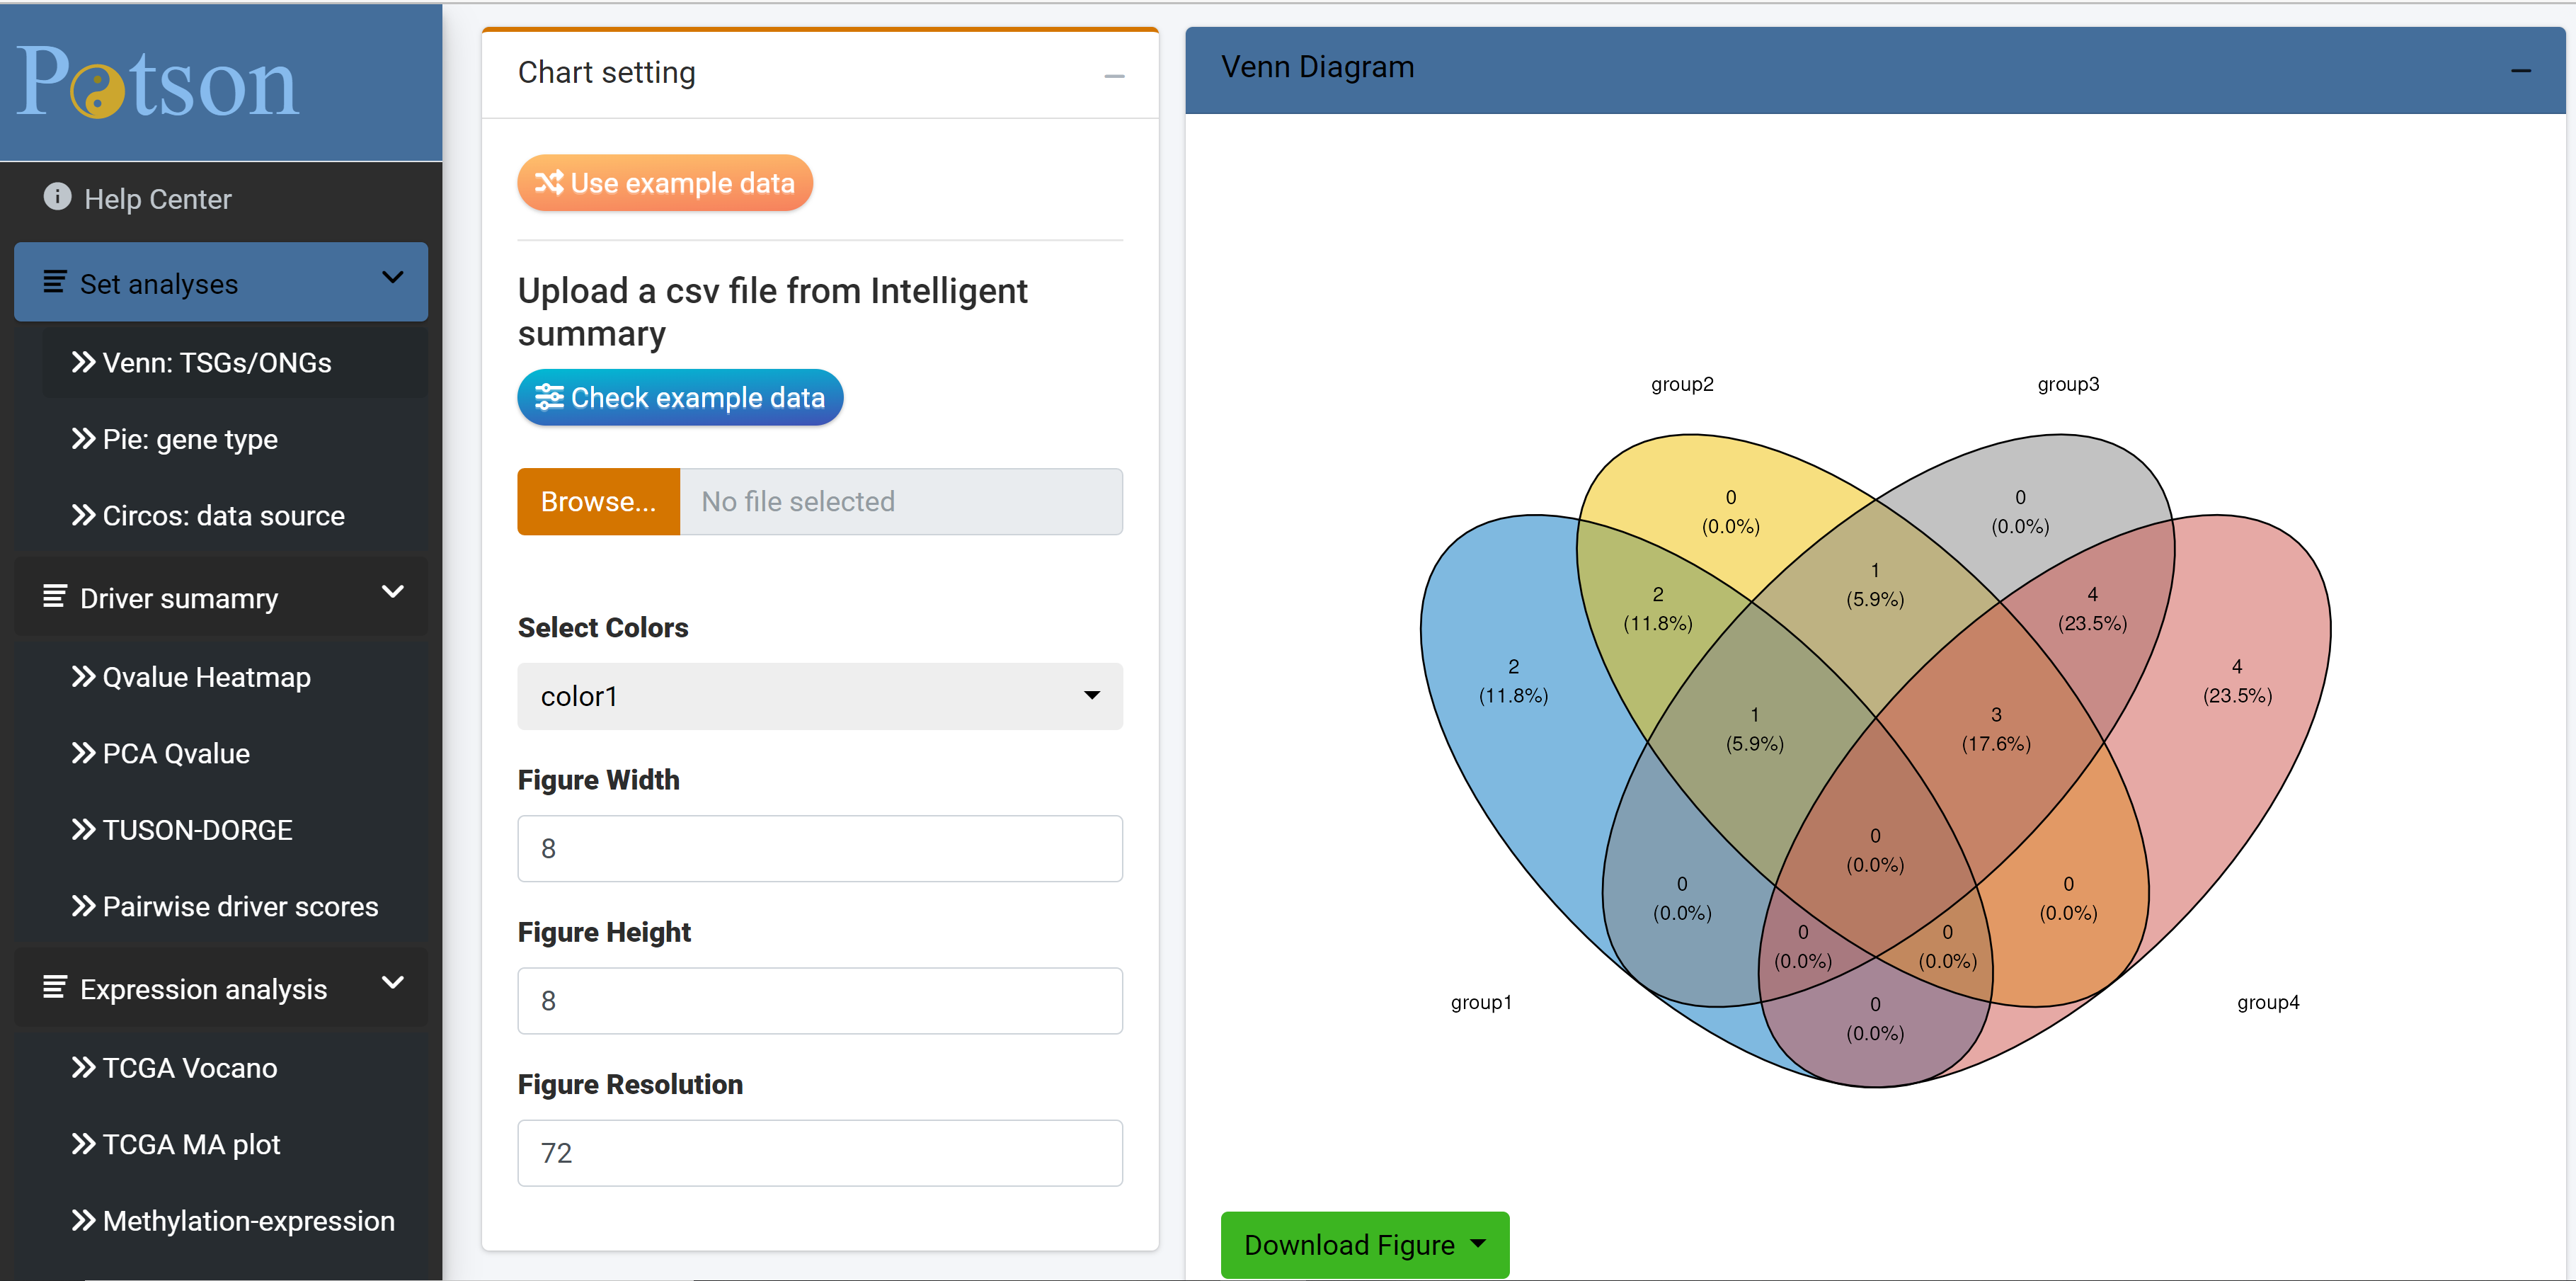
The set analysis will present the basic results using Venn and Pie chart, which will give your an overview of your input gene list. They could answer how many tumor suppressors, oncogenes and dual-role genes in your gene of interest. The outcome will be a downloadable plot as below.
4.2 Annotation summary
The annotation plots will be focusing on the questions about how many genes of interest are confirmed tumor suppressor and oncogenes. Users can use the setting interfact in the middle to choose specific color and output format, and the plot will change dynamically.
4.3 Gene differential expression
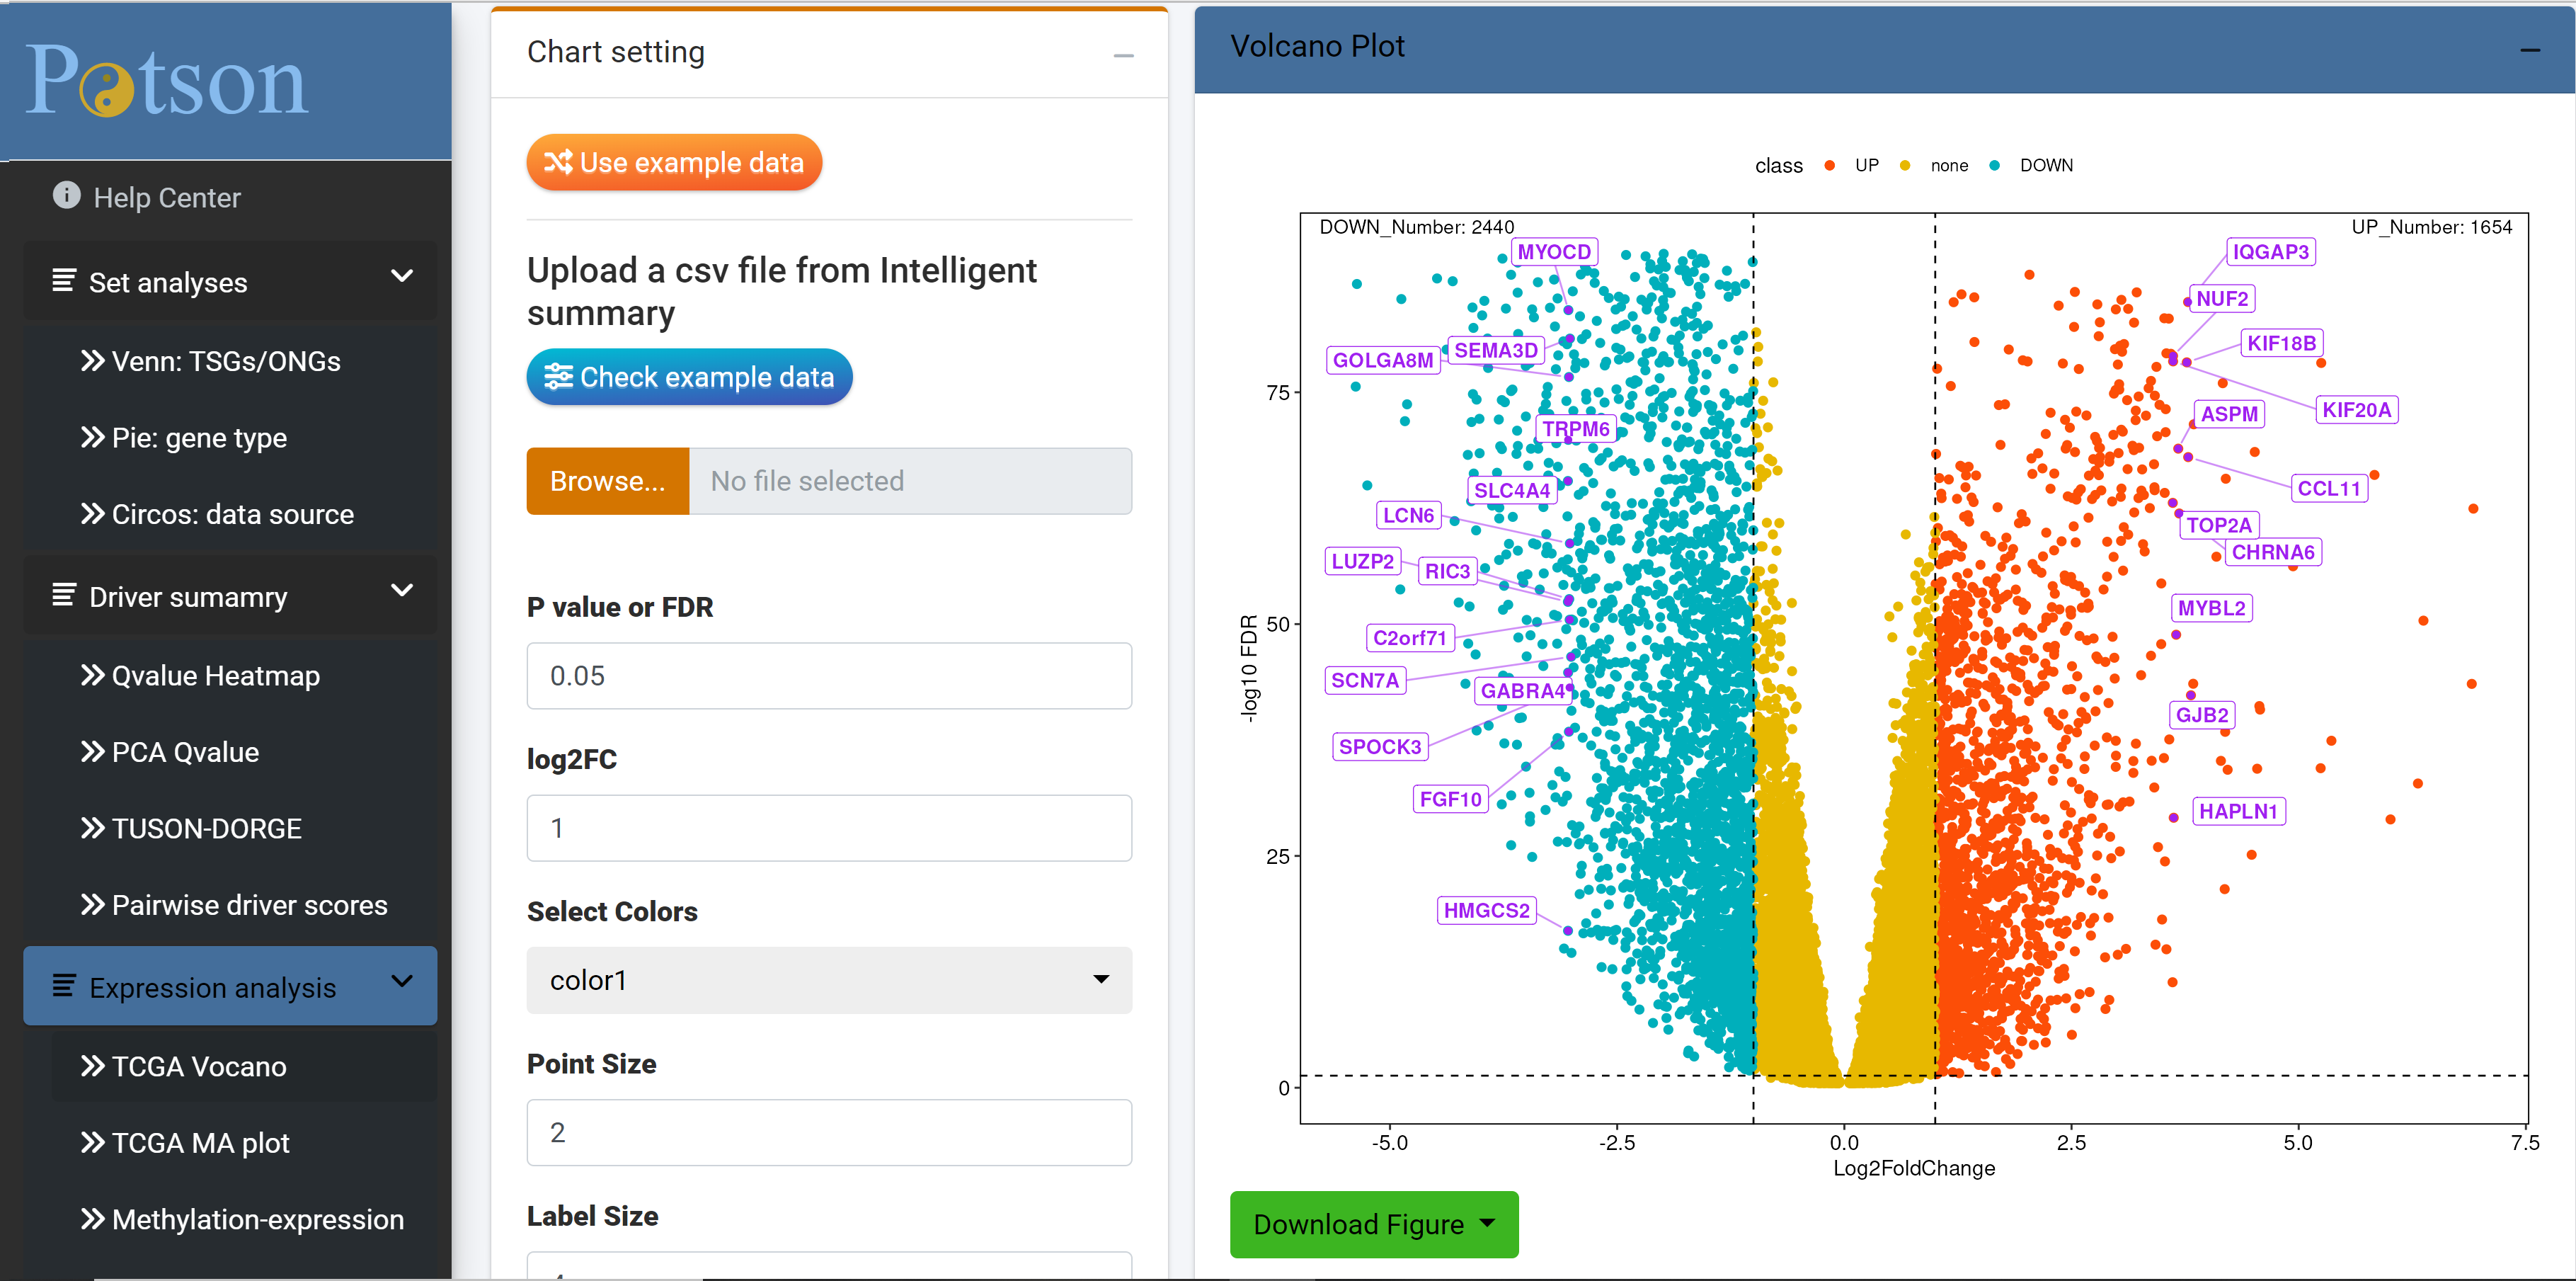
In this modules, the four charts will be used to process the 40+ outputs from the intelligent summary. In our interlligent summary, we are mainly generate the input files based TCGA pan-cancer dataset. User could use the similar format and apply to your own differential expression results.
4.4 Gene expression profile analysis
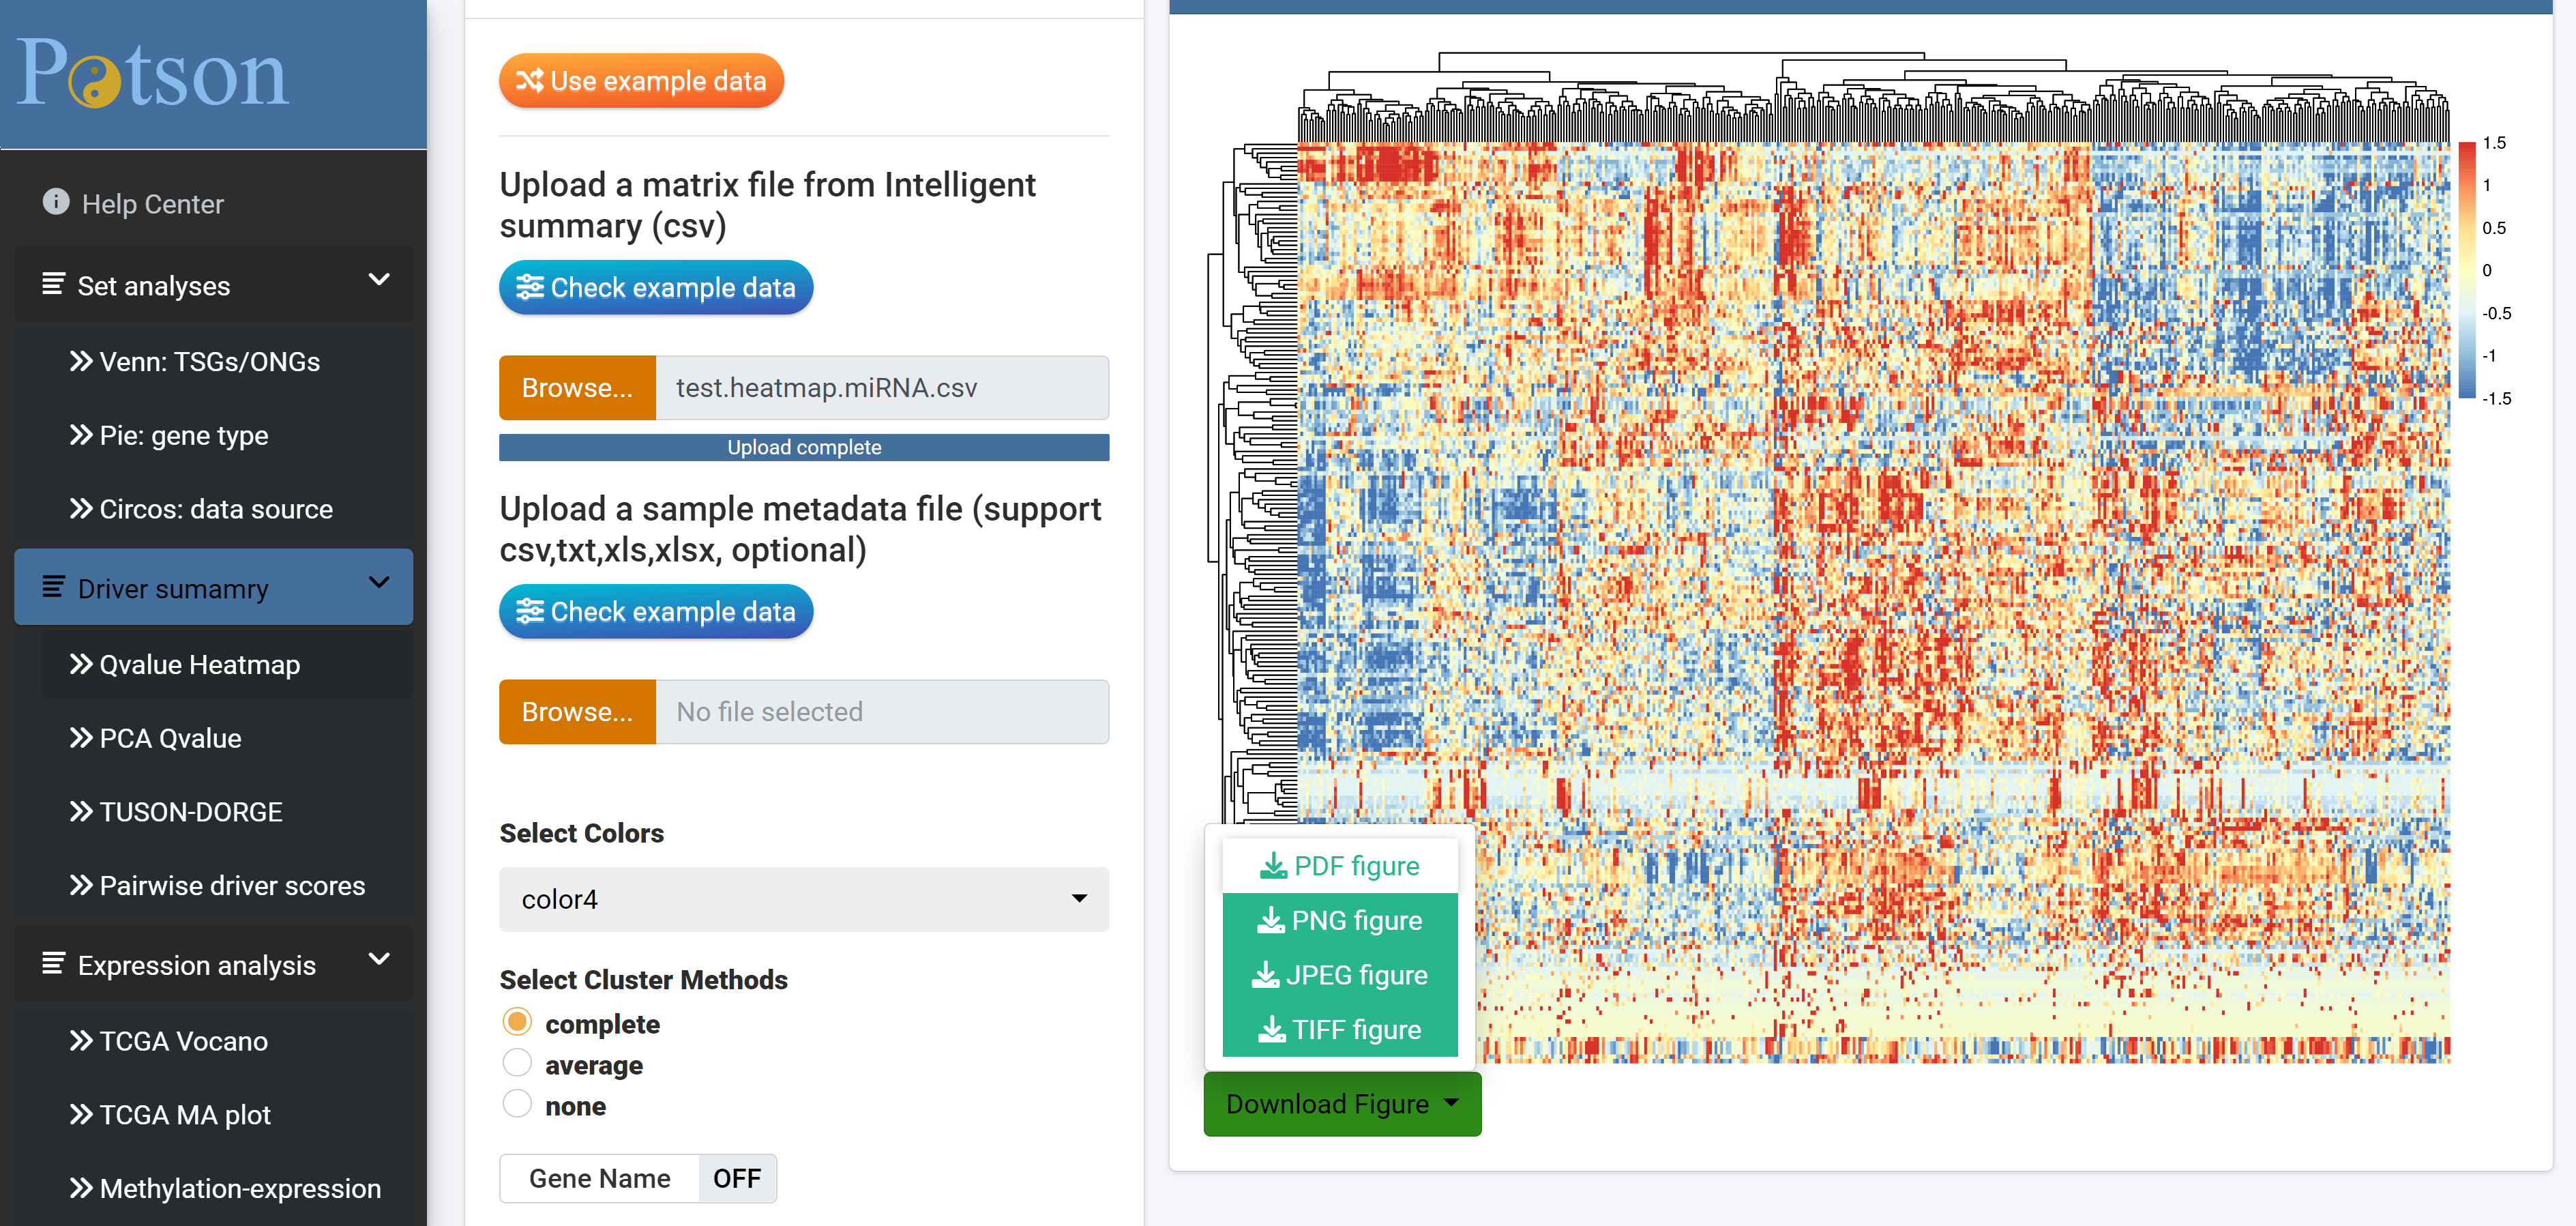
In this module, it shows the data plots based on the matrix profile from gene expression and methylation. The input files are prepaed based on the TCGA dataset, user could prepare the any similar file based in the matrix style.
5. Data download
There are 147 data files available for non-commercial users on the download page. The downloading file could be filtered based on the data type and cancer type information. All of the files are in tabular plain text format and can be used for advanced analysis, such as excel-based extraction and annotation summary.
6. How to cite
Please cite: Yining Liu, Min Zhao, POTSON: a data portal of tumor suppressors and oncogenes.